Feature Selection using Genetic Algorithms
For a more interactive experience a Kaggle version can be found through this notebook.
Introduction
I am currently going through a course of metaheuristics and one of the programs that I implemented was Feature Selection through Genetic Algorithms.
In this case we are trying to optimize two different things.
1. Number of features
2. Fitness: In this case 1-r^2 score.
This poses a problem. How can we optimize for more than one variable?
A solution to this is to use the Pareto front. Which is the set of all the current pareto efficent solutions.
Imports and load Dataset
First, let's do some imports and load the dataframe we are trying to predict.
import pandas as pd
import numpy as np
import matplotlib.pyplot as plt
import seaborn as sns
from sklearn.linear_model import LinearRegression
from sklearn.ensemble import RandomForestClassifier
from sklearn.metrics import mean_absolute_error, r2_score
from sklearn.model_selection import train_test_split
df = pd.read_csv('./Datasets/wine.csv')
X = df.drop('quality', axis=1)
y = df['quality']
Pareto efficient solutions
Pareto efficiency is a situation where no action or allocation is available that makes one individual better off without making another worse off. - Pareto efficiency.
In this case, for every new feature that I add. I can see that it might benefit me. But I might not want to use all of the features in a dataset, so I can see which are the features that are the most helpful considering the tradeoff between the most amount of features and the least amount of r^2 score lost.
The pareto front
The pareto front normally can be seen as a frontier closest to the origin. In this case, we are trying to minimize so its going to be the closest, in the case that we try to maximize we could grab the one least close to the origin or multiply everything by minus one.

Non dominated sort
Now that we know what a pareto front solution is, we are going to rank our current solutions based on the level of the pareto front they are currently at.
We can do this with a simple algorithm.
- Generate the current pareto front.
- Rank this as the ith best solutions.
- Remove the current ith best pareto front.
- Repeat from 1 until you have no points left.

In this case, we are implementing the fast version or version 2 of this algorithm.
In this version you should generate a graph from the non-dominated (the pareto efficient solutions) to the dominated (the rest of the solutions).
After this, run a variation of Kahn's algorithm for topological sorting.
For each element that currently has no in-degrees, remove it and put it as part of the ith ranking. Repeat until there are no more elements in the graph.

Note: In theory for the first iteration, there should be lines from the pareto front marked as zero to the rest of the the points, but drawing those lines became to messy. Just imagine that the pareto front marked as zero dominates the rest of the points and not just the first pareto front
The following is an implementation of this second method.
def fast_non_dominated_sort(population):
    '''
    Input:
	population list(Individual): .
    Output:
	rankings (list(int)): The current rankings.
    '''

    numbers = [i for i in range(0, len(population))]
    numbered_population = list(zip(population, numbers)) # tuple(fitness, array_solution, number)

    # Initialize
    exdegrees = [0]*len(numbers)
    dominated_by = [None]*len(numbers)
    rankings = [0]*len(numbers)

    for i in numbers:
	rankings[i] = 0
	dominated_by[i] = set()

    # Calculate exdegrees
    for i, numbered_individual in enumerate(numbered_population):
	is_dominated = False
	tested_individual = numbered_individual[0]
	number = numbered_individual[1]

	# Get the exdegrees
	for i, individual in enumerate(population):

	    if tested_individual.r2_score > individual.r2_score and tested_individual.n_features >= individual.n_features and i != number:
		exdegrees[number] += 1
		dominated_by[number].add(i)
		# They are the same point, remove them to not create a cyclic dependecy
		if tested_individual.r2_score == individual.r2_score and tested_individual.n_features == individual.nfeatures and i == number:
		    exdegrees[number] -= 1
		    dominated_by[number].remove(i)

    numbered_exdegrees = list(zip(exdegrees, numbers))
    q = []
    level = 0
    used = set()

    # first time
    for element in numbered_exdegrees:
	if element[0] == 0 and not used:
	    q.append(element[1])

    for i in range(len(population)):
	while q:
	    # get first element
	    current_number = q[0]
	    q.pop(0)

	    rankings[current_number] = level
	    used.add(current_number)

	    for i, sett in enumerate(dominated_by):
		size = len(sett)
		sett.discard(current_number)
		new_size = len(sett)
		if size != new_size:
		    numbered_exdegrees[i] = (numbered_exdegrees[i][0]-1, numbered_exdegrees[i][1])

	# add each item that is now possible
	for element in numbered_exdegrees:
	    if element[0] == 0 and element[1] not in used:
		q.append(element[1])

	if len(used) == len(rankings):
	    break
	level += 1

    for i, rank in enumerate(rankings):
	population[i].rank = rank

    return population
The individuals class
I created an individuals class to manage them more easily and to debug without a problem.
class Individual:
    def __init__(self, genotype, n_features):
	self.genotype=genotype
	self.n_features=n_features
	self.r2_score=-1
	self.rank=-1
    def __repr__(self):
	return f"Individual(genotype={self.genotype}, fitness=({self.r2_score}, {self.n_features}), rank={self.rank})"
Creating the Genetic Algorithm
Some pseudocode for a possible genetic algorithm could be the following:
- Create the initial population.
- Calculate the population fitness.
- Get the elite.
- While iteration < Generations:
-
- Crossover selecting the parents.
- Mutate population.
- Calculate the fitness of population.
- Get the current elite.
That is it, now, the following are implementations of each of this parts.
Creating an initial population
def create_population(N, gene_pool, maximum_value):
    initial_population = []
    for _ in range(N):

	genotype = rng.integers(maximum_value, size=len(X.columns))
	n_features = sum(genotype)/len(genotype)
	initial_population.append(Individual(genotype, n_features))
    return initial_population
rng = np.random.default_rng(seed=42)
trial_population = create_population(10, len(X.columns) , 2)
create_population(10, len(X.columns) , 2)
[Individual(genotype=[0 0 1 0 0 0 0 1 1 0 1], fitness=(-1, 0.36363636363636365), rank=-1),
 Individual(genotype=[0 0 0 0 0 1 1 1 0 0 0], fitness=(-1, 0.2727272727272727), rank=-1),
 Individual(genotype=[0 0 1 1 1 1 1 1 0 1 1], fitness=(-1, 0.7272727272727273), rank=-1),
 Individual(genotype=[1 1 0 1 0 1 1 1 0 1 1], fitness=(-1, 0.7272727272727273), rank=-1),
 Individual(genotype=[0 0 1 1 1 1 0 1 0 1 0], fitness=(-1, 0.5454545454545454), rank=-1),
 Individual(genotype=[1 0 1 0 0 1 0 1 1 1 0], fitness=(-1, 0.5454545454545454), rank=-1),
 Individual(genotype=[0 0 1 1 1 1 0 0 0 0 0], fitness=(-1, 0.36363636363636365), rank=-1),
 Individual(genotype=[0 0 0 1 1 1 0 0 0 0 1], fitness=(-1, 0.36363636363636365), rank=-1),
 Individual(genotype=[1 0 0 0 0 1 1 1 1 1 1], fitness=(-1, 0.6363636363636364), rank=-1),
 Individual(genotype=[1 1 0 1 1 1 1 1 1 0 1], fitness=(-1, 0.8181818181818182), rank=-1)]
Calculating the fitness
Right now, I am hardcoding a LinearRegressor as our current model, but later, I will change it so that any arbitrary model can be used.
def individual_fitness(individual, X, y):
    '''
    Calculate the fitness for the current algorithm.

    Input:
	individual (list(Individual))
	X: The features of the df
	y: The feature to predict
    Output:
	fitness (tuple(float, float)): The current fitness in this case it is 1-r^2 and
    '''
    X = X.copy()
    mask = []
    cont = 0

    for i in individual.genotype:
	if i == 1:
	    mask.append(True)
	    cont += 1
	else:
	    mask.append(False)

    if cont == 0:
	rng = np.random.default_rng(seed=42)
	random_change = rng.integers(len(X.columns))
	mask[random_change] = True
	individual.genotype[random_change] = 1

    filtered_X = X.loc[:, mask]

    X_train, X_test, y_train, y_test = train_test_split(filtered_X, y, test_size=0.33, random_state=42)
    lr = LinearRegression(n_jobs=-1)
    lr.fit(X_train, y_train)
    y_preds = lr.predict(X_test)
    r2_current_score = 1-r2_score(y_test, y_preds)


    n_features = sum(individual.genotype)/len(individual.genotype)

    individual.n_features = n_features
    individual.r2_score = r2_current_score
    return individual
individual_fitness(trial_population[0], X, y)
Individual(genotype=[0 1 1 0 0 1 0 1 0 0 1], fitness=(0.6985795098341726, 0.45454545454545453), rank=-1)
def population_fitness(population, X, y):
    '''
    Calculate the fitness for all of the population.
    Input:
	population (list): N individuals
	X: The features of the df
	y: The feature to predict
    Output:
	population_fitness (tuple(float, list)): A list of evaluated individuals.
    '''
    evaluated_fitness = []
    for individual in population:
	evaluated_fitness.append(individual_fitness(individual, X, y))

    population = fast_non_dominated_sort(evaluated_fitness)

    return population
evaluated_individuals = population_fitness(trial_population, X, y)
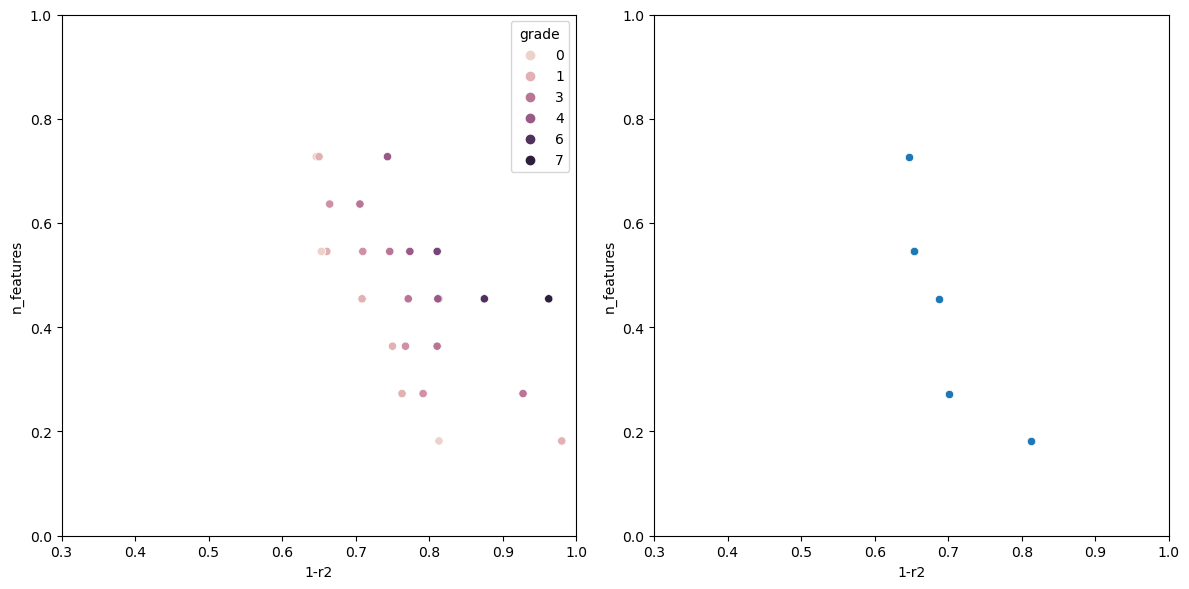
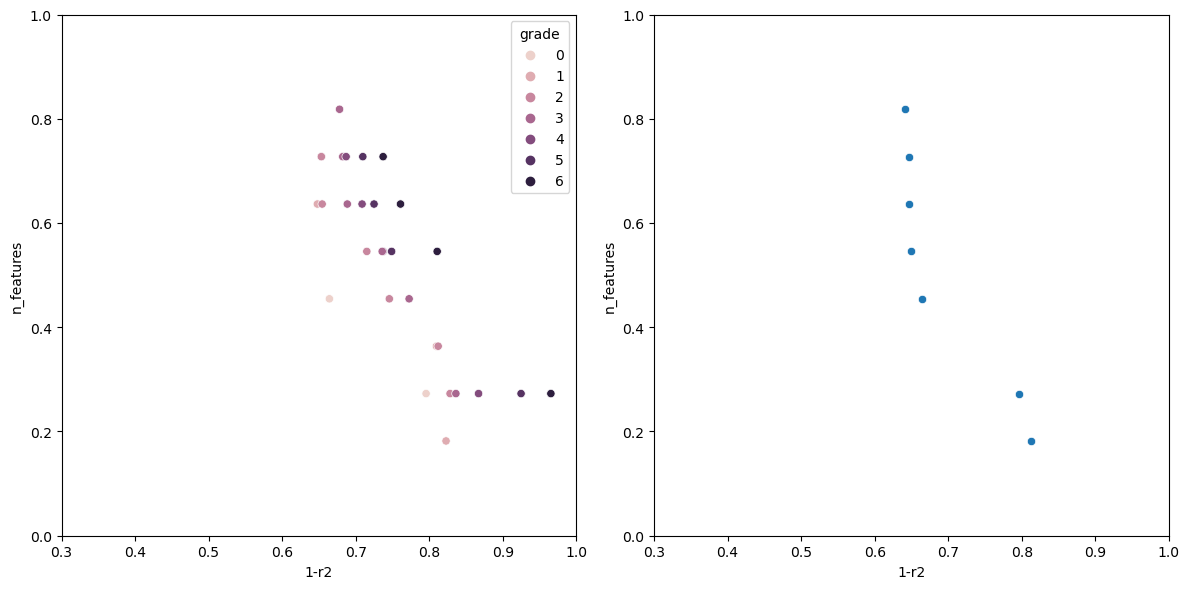
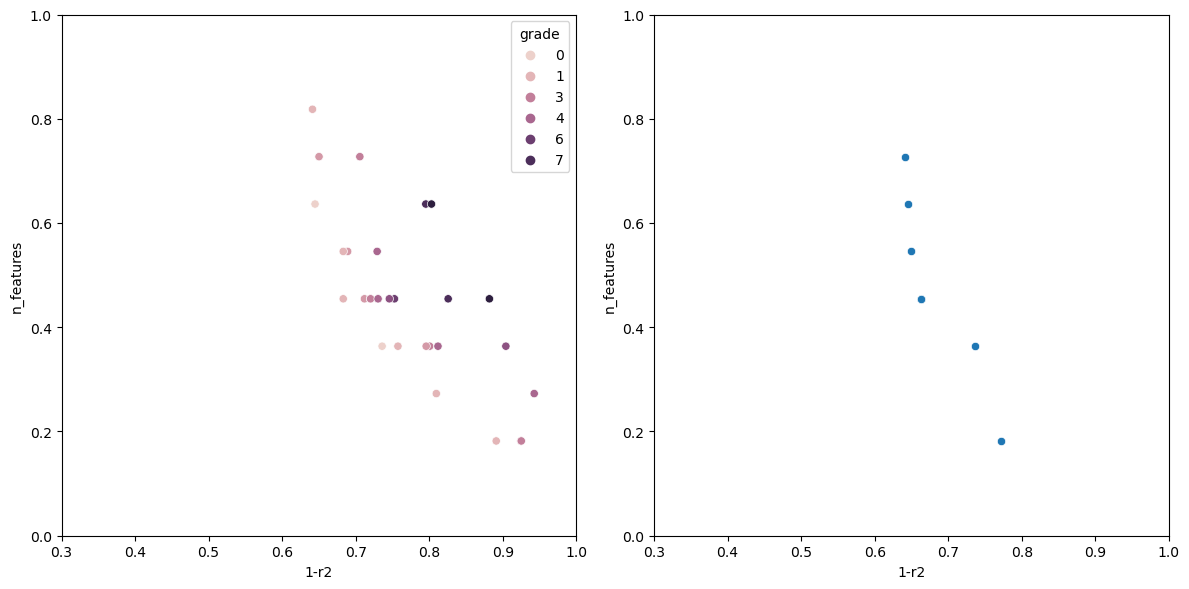
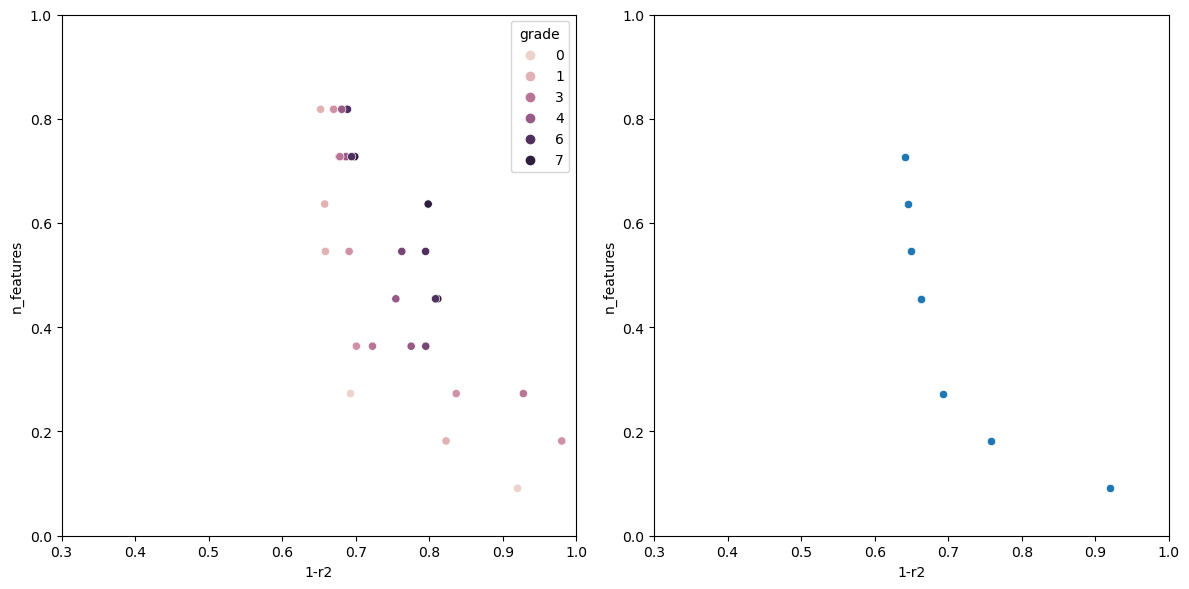
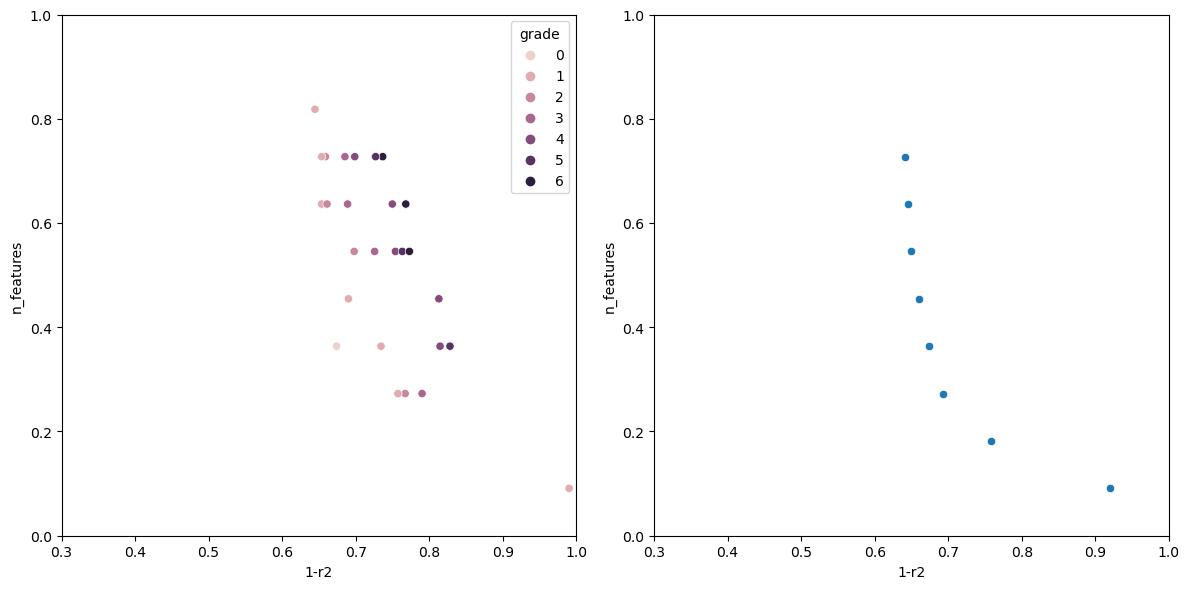
Graphing the results
After evaluating the model, it would be nice to have a way to visualize how each model performed.
def graph_rankings(population, elites):
    '''
	population:
    '''
    fig, (ax1, ax2) = plt.subplots(ncols=2, figsize=(12, 6))
    #sns.set(rc={"figure.figsize":(5, 5)})
    r2_score = [individual.r2_score for individual in population]
    n_features = [individual.n_features for individual in population]
    grade = [individual.rank for individual in population]
    finalized_scores = pd.DataFrame({'1-r2':r2_score, 'n_features': n_features, 'grade': grade})


    r2_score = [individual.r2_score for individual in elites]
    n_features = [individual.n_features for individual in elites]
    elites =  pd.DataFrame({'1-r2':r2_score, 'n_features': n_features})


    scatter1 = sns.scatterplot(finalized_scores, x='1-r2', y='n_features', hue='grade', ax=ax1)
    scatter2 = sns.scatterplot(elites, x='1-r2', y='n_features', ax=ax2)

    # Set limits for both graphs
    ax1.set_xlim(0.3, 1.0)
    ax1.set_ylim(0.0, 1.0)
    ax2.set_xlim(0.3, 1.0)
    ax2.set_ylim(0.0, 1.0)

    plt.tight_layout()
    plt.show()
graph_rankings(evaluated_individuals, [individual for individual in evaluated_individuals if individual.rank == 0])
Parent Selection
In this case, I decided to go for a tournament selection.
def parent_selection_tournament(population):
    '''
	Parent selection based on tournament selection.
	Input:
	    parents: List of lists of parents to evaluate.

	Output:
	    parent: The best parent.
    '''
    idx1 = np.random.randint(low=0, high=len(population))
    idx2 = np.random.randint(low=0, high=len(population))

    while idx1 == idx2:
	idx2 = np.random.randint(low=0, high=len(population))

    parent1 = population[idx1]
    parent2 = population[idx2]

    if parent1.rank <= parent2.rank:
	return parent1
    else:
	if parent1.r2_score < parent2.r2_score:
	    return parent1
	else:
	    return parent2
print(evaluated_individuals[0].rank, evaluated_individuals[1].rank)
parent_selection_tournament(evaluated_individuals)
Crossover
I decided to combine the parents in here based on a uniform distribution, but in the class version I implemented another way.
def crossover(population: list, pc: float):
    '''
    Crossover operation on a population of parents.

    Input:
	population (list): parents
	fitness (list): list of evaluated fitness for the population.
	pc (float): probability of crossover
    Output:
	individuals (list):

    '''
    new_population = []
    for i in range(len(population)):
	prob = np.random.uniform(0, 1)
	if prob < pc:
	    parent1 = parent_selection_tournament(population)
	    parent2 = parent_selection_tournament(population)
	    genotype = combine_parents(parent1, parent2, 0.5)
	    n_features = sum(genotype)/len(genotype)
	    new_population.append(Individual(genotype, n_features))
	else:
	    parent = parent_selection_tournament(population)
	    clone = parent
	    new_population.append(clone)
    return new_population

    def combine_parents(parent1, parent2, probability):
	'''
	Helper function for crossover.
	This is an implementation of the uniform crossover.
	probability: the probability of choosing parent1 over parent2.
	'''
	child = []

	for i in range(len(parent1.genotype)):
	    if np.random.uniform(0, 1) < probability:
		child.append(parent1.genotype[i])
	    else:
		child.append(parent2.genotype[i])
	return child
cross = crossover(evaluated_individuals, 0.5)
crossover(evaluated_individuals, 0.5)
Mutation
    def mutation(population: list, pm: float):
        '''
        Mutation on a population.
        Input:
    	population (list): parents
    	probability (float): probability of mutation

        Output:
    	individuals (list):
        '''
        new_population = []

        for individual in population:
    	    if np.random.uniform(0, 1) < pm:
    	        # mutate
    	        mutated_individual = mutate_one_feature(individual)
    	        new_population.append(mutated_individual)
    	    else:
    	        new_population.append(individual)
    	        return new_population

    def mutate_one_feature(individual):
        idx = np.random.randint(low=0, high=len(individual.genotype))
	individual.genotype[idx] = 0 if individual.genotype[idx] else 1
	return individual
mutated_individual = mutation(evaluated_individuals, 0.5)
mutation(evaluated_individuals, 0.5)
Manage elites
Get the best members of the current population and do a fast non dominated sort. After that, just grab the ones that ranked the best.
def manage_elites(population, elite):
    '''
    Input:
	population (list): the individuals
	elite list(tuple(float, float), list): best individuals

    Output:
	elite (tuple(float, float), list): The current elite individual
    '''

    # Merge both normal_population and elite
    population = population + elite

    # Rankings are indexed
    population = fast_non_dominated_sort(population)

    elite = [individual for individual in population if individual.rank == 0]

    return elite
Genetic algorithm
Finally, putting it all together, the implementation of the genetic algorithm is the following.
def genetic_algorithm(N, G, pr, pm, X, y):
    '''
    Input:
	N (int): Population size
	G (int): Maximum number of generations
	pr (float): reproduction's probability
	pm (float): mutations probability
    Output:
	elite (list): the best individual throught the generations
    '''

    population = create_population(N, len(X.columns), 2)
    population = population_fitness(population, X, y)
    elite = population

    fitness_over_time = [elite]

    for i in range(G):
	population = crossover(population, pr)
	population = mutation(population, pm)
	population = population_fitness(population, X, y)

	elite = manage_elites(population, elite)

	fitness_over_time.append(elite)
	if i%10 == 0:
	    graph_rankings(population, elite)

    return fitness_over_time
fitness_over_time = genetic_algorithm(20, 100, 0.8, 0.5, X, y)
The Genetic Algorithm class
I wanted to have a more portable version of the code. So I decided to have a class version of the code. Everything except for the fast non dominated is again replicated down there and can be used calling the genetic_algorithm() method. Now, it would return the elite individuals and would print the best pareto front of the elites.
class GeneticAlgorithm:
    def __init__(self, N, G, model, pc, pm, X, y):
	"""
	Input:
	    N (int): The size of the population.
	    G (int): The number of generations.
	    X (DataFrame): The features of the df.
	    y (DataFrame): The feature to predict.
	    model: A model that uses the sklearn api to train and infer.
	    pc: Probability of crossover.
	    pm: Probability of mutation.
	"""
	self.N = N
	self.G = G
	self.population = []
	self.model = model
	self.n_features = len(X.columns)
	self.X = X
	self.y = y
	self.pc = pc
	self.pm = pm

	for _ in range(N):
	    genotype = np.random.randint(2, size=self.n_features)
	    n_features = sum(genotype)/self.n_features
	    self.population.append(Individual(genotype, n_features))

    def _individual_fitness(self, individual):
	"""
	Calculate the fitness for the current individual.

	Input:
	    individual (Individual): The individual to be evaluated.
	Output:
	    evaluated_individual: The individual evaluated on 1-r2_score and n_features.
	"""

	mask = []
	cont = 0

	for i in individual.genotype:
	    if i == 1:
		mask.append(True)
		cont += 1
	    else:
		mask.append(False)

	if cont == 0:
	    rng = np.random.default_rng(seed=42)
	    random_change = rng.integers(len(X.columns))
	    mask[random_change] = True
	    individual.genotype[random_change] = 1

	filtered_X = X.loc[:, mask]

	X_train, X_test, y_train, y_test = train_test_split(filtered_X, y, test_size=0.33, random_state=42)
	model = self.model
	model.fit(X_train, y_train)
	y_preds = model.predict(X_test)
	r2_current_score = 1-r2_score(y_test, y_preds)


	n_features = sum(individual.genotype)/len(individual.genotype)

	individual.n_features = n_features
	individual.r2_score = r2_current_score
	return individual

    def _population_fitness(self):
	"""
	Calculate the fitness for all of the population.
	Input:
	    population (list): N individuals
	Output:
	    population_fitness (tuple(float, list)): A list of evaluated individuals.
	"""
	evaluated_fitness = []

	for individual in self.population:
	    evaluated_fitness.append(self._individual_fitness(individual))

	population = fast_non_dominated_sort(evaluated_fitness)

	return population

    def _graph_rankings(self, elites):
	"""
	Graph the current state for the entire population and the elite individual.
	Input:
	    elites: The best individuals over all generations.

	Output:
	    There is no output, it graphs the state of the population and elites.
	"""

	fig, (ax1, ax2) = plt.subplots(ncols=2, figsize=(12, 6))
	#sns.set(rc={"figure.figsize":(5, 5)})
	r2_score = [individual.r2_score for individual in self.population]
	n_features = [individual.n_features for individual in self.population]
	grade = [individual.rank for individual in self.population]
	finalized_scores = pd.DataFrame({'1-r2':r2_score, 'n_features': n_features, 'grade': grade})


	r2_score = [individual.r2_score for individual in elites]
	n_features = [individual.n_features for individual in elites]
	elites_df =  pd.DataFrame({'1-r2':r2_score, 'n_features': n_features})


	scatter1 = sns.scatterplot(finalized_scores, x='1-r2', y='n_features', hue='grade', ax=ax1)
	scatter2 = sns.scatterplot(elites_df, x='1-r2', y='n_features', ax=ax2)

	# Set limits for both graphs
	ax1.set_xlim(0.3, 1.0)
	ax1.set_ylim(0.0, 1.0)
	ax2.set_xlim(0.3, 1.0)
	ax2.set_ylim(0.0, 1.0)

	plt.tight_layout()
	plt.show()

    def _parent_selection_tournament(self, population):
	'''
	    Parent selection based on tournament selection.
	    Input:
		parents: List of lists of parents to evaluate.

	    Output:
		parent: The best parent.
	'''
	idx1 = np.random.randint(low=0, high=len(population))
	idx2 = np.random.randint(low=0, high=len(population))

	while idx1 == idx2:
	    idx2 = np.random.randint(low=0, high=len(population))

	parent1 = population[idx1]
	parent2 = population[idx2]

	if parent1.rank <= parent2.rank:
		return parent1
	else:
		if parent1.r2_score < parent2.r2_score:
			return parent1
		else:
			return parent2

    def _crossover(self):
	'''
	Crossover operation on a population of parents.

	Output:
	new_population (list): A new population that has been crossed over.
	'''

	new_population = []

	for i in range(self.N):
	    prob = np.random.uniform(0, 1)

	    if prob lt; self.pc:
	    	parent1 = self._parent_selection_tournament(self.population)
	    	parent2 = self._parent_selection_tournament(self.population)
	    	genotype = self._combine_parents(parent1, parent2)
	    	n_features = sum(genotype)/len(genotype)
	    	new_population.append(Individual(genotype, n_features))
	    else:
	    	parent = self._parent_selection_tournament(self.population)
	    	clone = parent
	    	new_population.append(clone)

	return new_population

    def _combine_parents(self, parent1, parent2):
    """
       Grab a random index and combine both parents beginning there.

       Helper function for crossover.
       Input:
         parent1: The list of genotype for the first parent.
         parent2: The list of genotype for the second parent.
       Output:
         offspring: A crossover for both parents.
    """
	break_point = np.random.randint(low=0, high=self.n_features)
	genotype1 = parent1.genotype
	genotype2 = parent2.genotype

	return np.append(genotype1[break_point:], genotype2[:break_point])

    def _mutate(self):
    """
       Mutate all of the population.

       Output:
	new_population (list): The new mutated population.
    """

    new_population = []

    for individual in self.population:
        if np.random.uniform(0, 1) < self.pm:
    	    mutated_individual = self._mutate_one_feature(individual)
    	    new_population.append(mutated_individual)
    	else:
    	    new_population.append(individual)

    return new_population

    def _mutate_one_feature(self, individual):
        idx = np.random.randint(low=0, high=len(individual.genotype))
        individual.genotype[idx] = 0 if individual.genotype[idx] else 1
        return individual

    def _manage_elites(self, population, elite):
    '''
    Input:
    population (list): the individuals
    elite list(tuple(float, float), list): best individuals

    Output:
    elite (tuple(float, float), list): The current elite individual
    '''

	population = population + elite
	population = fast_non_dominated_sort(population)

	elite = [individual for individual in population if individual.rank == 0]

	return elite

    def _print_solutions(self, elites):
       """
       Print the solutions of the elites.
       """
        unique_individuals = {}
	for individual in elites:
	    n_features = individual.n_features

	    if n_features not in unique_individuals:
	        unique_individuals[n_features] = individual

		elites =  list(unique_individuals.values())
	        elites.sort(key= lambda individual: individual.n_features)

		for individual in elites:

		     mask = []
	             cont = 0
		     for i in individual.genotype:
		         if i == 1:
		             cont += 1
			     mask.append(True)
			 else:
			     mask.append(False)
	             cols = X.loc[:, mask].columns
		     cols = list(cols)
		     print()
		     print("The individual with n_features:", cont)
	             print("\tHas the following fitness:", individual.r2_score)
		     print("\tColumns used->", cols)
		     print()

    def genetic_algorithm(self):
       """
       The implementation of genetic algorithm.
       """
           self.population = self._population_fitness()
	   elite = [individual for individual in self.population if individual.rank == 0]

	   for i in range(self.G):
		self.population = self._crossover()
		self.population = self._mutate()
		self.population = self._population_fitness()

		elite = self._manage_elites(self.population, elite)

		if i%10 == 0:
		    self._graph_rankings(elite)
		    self._print_solutions(elite)

	    return elite
ga = GeneticAlgorithm(N=30, G=40, model=LinearRegression(n_jobs=-1), pc=0.6, pm=0.7, X=X, y=y)
elites = ga.genetic_algorithm()
Now running the algorithm gives us the following output.
The individual with n_features: 1
	Has the following fitness: 0.9199570400385672
	Columns used-> ['sulphates']


The individual with n_features: 2
	Has the following fitness: 0.7578008670371558
	Columns used-> ['sulphates', 'alcohol']


The individual with n_features: 3
	Has the following fitness: 0.6928505981395727
	Columns used-> ['volatile acidity', 'total sulfur dioxide', 'alcohol']


The individual with n_features: 5
	Has the following fitness: 0.659681296101031
	Columns used-> ['volatile acidity', 'free sulfur dioxide', 'total sulfur dioxide', 'sulphates', 'alcohol']


The individual with n_features: 6
	Has the following fitness: 0.6490835368389359
	Columns used-> ['fixed acidity', 'volatile acidity', 'chlorides', 'total sulfur dioxide', 'sulphates', 'alcohol']


The individual with n_features: 7
	Has the following fitness: 0.6446328316470582
	Columns used-> ['volatile acidity', 'chlorides', 'total sulfur dioxide', 'density', 'pH', 'sulphates', 'alcohol']


The individual with n_features: 8
	Has the following fitness: 0.6406986424594847
	Columns used-> ['volatile acidity', 'citric acid', 'chlorides', 'free sulfur dioxide', 'total sulfur dioxide', 'pH', 'sulphates', 'alcohol']
Conclusion
Now we know which ones are going to be the features that are the best. The class version of this code can use different models.
The best part of this code is that it can be used as a standalone class which is portable.