Making: Check CPU
(CCPU)

TLDR:
Learning Rust by making a small TUI to check my CPU usage
Introduction:
I want to learn rust in a simple project. Maybe I am biting more than
I can chew in here.
So let’s set up some goals.
The goals of this projects are:
- Read the CPU current usage.
- Differentiate the CPU threads usage.
- Ideally plot each core with a graphing library.
Let’s start.
Coding CCPU:
I googled for a rust crate to check if there was an abstraction over
syscalls to check cpu information and found one called
sysinfo. Searching for terminal user interfaces in rust
gave me a result, rata-tui.
rata-tuiis a graphics library that can help you make pretty terminal user interfaces.sysinfoa library that abstracts away calls to the specific OS you are currently using and tells you information about your system.
I installed both, ratatui and sysinfo to
the system.
cargo add ratatui crossterm sysinfoI played around a bit with the sysinfo example code.
After getting familiar I decided to learn about the CPU usage and found
this link.
It’s perfect! It tells me the cpu name and the usage per core!
Snippet from their docs:
use sysinfo::{System, RefreshKind, CpuRefreshKind};

        let mut s = System::new_with_specifics(
            RefreshKind::new().with_cpu(CpuRefreshKind::everything()),
        );

        // Wait a bit because CPU usage is based on diff.
        std::thread::sleep(sysinfo::MINIMUM_CPU_UPDATE_INTERVAL);
        // Refresh CPUs again.
        s.refresh_cpu();

        for cpu in s.cpus() {
            println!("{}%", cpu.cpu_usage());
            // and from a bit below
            println!("{}", cpu.name());
}- Read the CPU current usage.
- Differentiate the CPU threads usage.
- Ideally plot each core with a graphing library.
After fullfilling the first part of my requirements, I decided to dig
into how to use rata-tui, the graphics library.
I did the excellent counter app example that get’s you from zero to hero in like an hour.
After that, I looked into the examples folder and saw that they had an example that exactly fullfilled what I wanted to do. A chart!
I used the example as a base and mixed it with what I had for CPUs.
I made an App struct for all of the state in the app as
recommended by the rata-tui people.
struct App {
            window: [f64; 2],
            cpu_data: Vec<(f64, f64)>,
            cpu_threads: Vec<Vec<(f64, f64)>>,
            max_data_size: usize,
            current_index: usize,
        }
I wanted to make it feel as if you went to the next page everytime the plot is full. I felt a clever by just using the same array and reseting it every time you reach the end.
 fn on_tick(&mut self, system: &mut System) {
                // update threads
                let cpu_threads = self.get_cpu_threads(system);

                for (i, &usage) in cpu_threads.iter().enumerate() {
                    let cpu = (self.current_index as f64, usage);
                    self.cpu_threads[i][self.current_index] = cpu;
                }


                // update cpu
                let cpu = (self.current_index as f64, self.get_cpu_data(system));
                self.cpu_data[self.current_index] = cpu;

                // update index --> smort
                self.current_index = (self.current_index + 1) % self.max_data_size;

                // reset
                if self.current_index == 0 {
                    for i in 0..self.cpu_threads.len() {
                        for j in 0..self.max_data_size {
                            self.cpu_threads[i][j] = (j as f64, i as f64);
                        }
                    }
                    for i in 0..self.max_data_size {
                        self.cpu_data[i] = (i as f64, 0.0);
                    }
                }
            }
The ui component is simple, two panels side by side to show both
graphs, a graph of overall cpu usage and another one for usage per
thread. And a top and bottom main_layer that I got from the
tutorial on the README of
rata-tui.
fn ui(f: &mut Frame, app: &App) {
            let main_layout =  Layout::new(
                Direction::Vertical,
                [
                    Constraint::Length(1),
                    Constraint::Min(0),
                    Constraint::Length(1),
                ],
            ).split(f.size());

            f.render_widget(
                Block::default()
                .title("Check CPU")
                .style(Style::default().add_modifier(Modifier::BOLD))
                .title_alignment(Alignment::Center),
                main_layout[0],
            );
            f.render_widget(
                Block::new()
                .style(Style::default().add_modifier(Modifier::ITALIC))
                .title("Press `q` to quit."),
                main_layout[2],
            );

            let dataset_cpu = vec![
             // generate dataset for general cpu
            ];
            let dataset_threads: Vec<Dataset> = app.cpu_threads.iter().enumerate().map(|(i, core_data)| {
              // go through each vector and generate a dataset for each thread
            }).collect();
            let chart_cpu = generate_chart("CPU Usage".to_string(), dataset_cpu, app.window);
            let chart_threads = generate_chart("Thread usage".to_string(), dataset_threads, app.window);

            let inner_layout = Layout::new(
                Direction::Horizontal,
                [Constraint::Percentage(30), Constraint::Percentage(70)],
            )
            .split(main_layout[1]);
            f.render_widget(
                chart_cpu,
                inner_layout[0],
            );
            f.render_widget(
                chart_threads,
                inner_layout[1],
            );
}- Read the CPU current usage.
- Differentiate the CPU threads usage.
- Ideally plot each core with a graphing library.
With all of the relevant bulletpoints done, we can move to the conclusion.
Conclusion
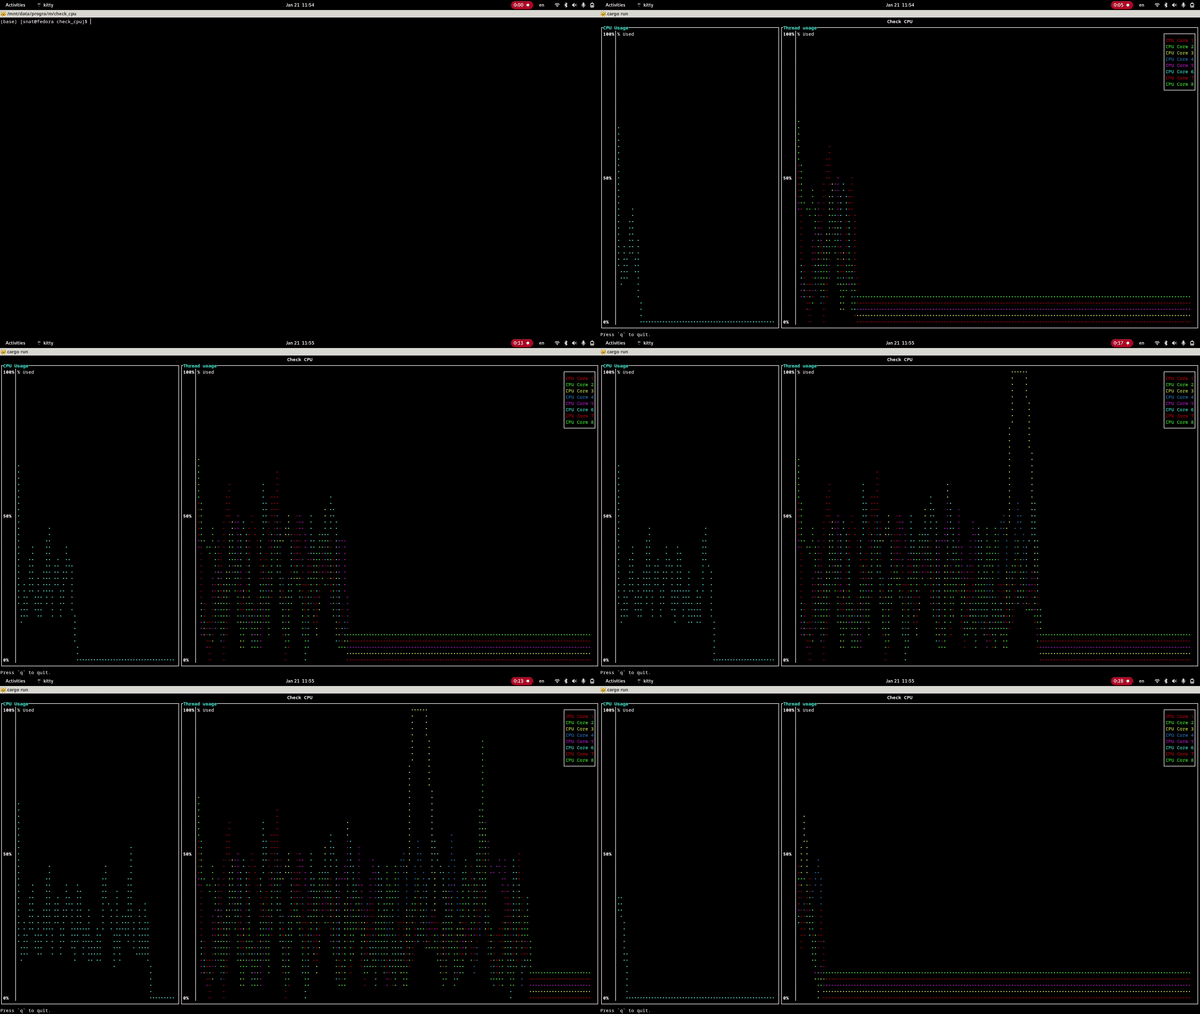
The final project looks like this:

I liked rust. The typing system that they have is nice and the compiler kind of guides you through common implementation mistakes. I specially loved the dead code messages.
Maybe I keep on working on the code of this and make an update for this. But for now, this code can be read in my m repo.